|
|
Post by yakers on Dec 6, 2023 2:12:09 GMT
Haven't done it yet but often reflected that if I need to make our portfolio simple for my wife to put all taxable in Wellington/Global Wellington and all traditional IRA in Wellsley. Probably something better out there but many things worse and that should just work for her.
|
|
|
|
Post by retiredat48 on Dec 6, 2023 5:22:30 GMT
Enough stress testing. Let's race those ponies in a long cross country race. Start date December 31, 1986. The horses are VWENX, FBALX, 60/40 VFINX/VFSMX and VWINX. Each starts with $10,000. First race, no withdrawals: www.portfoliovisualizer.com/backtest-portfolio?s=y&sl=2GFenlVcWi3dbrcfZ85R01Summary: Except for a short spell, Wellington led the race. The 60/40 hybrid ran second until 2003 when Fidelity passed it. In 2008 Wellesley passed it for third but fell back in 2013. 2023 finish: Wellington $273k, Fidelity $263k, Hybrid $214k, and Wellesley $170k. Second race, 3.3% initial withdrawal: www.portfoliovisualizer.com/backtest-portfolio?s=y&sl=6ZNLqZtLeEECM5qcJf6k3DSummary: Hybrid mostly held the lead until 2000. Wellington passes and holds the lead to the finish line. Hybrid starts falling back. Fidelity passes it for second in 2004 and holds it to the end. Wellesley passes Hybrid in 2008 and held it to 2013. 2023 finish: Wellington $158k, Federal $145k, Hybrid $119k and Wellesley $90k. Wellington is the clear winner if starting as far back as Portfolio Visualizer can go. Except for my back test using a 1968 start date there doesn’t seem to be a reason to own any other balanced fund than Wellington... or is there?
Chicken feed! You are aware I have owned Wellington Fund since 1953. Not a typo, 1953!
R48
|
|
|
|
Post by Mustang on Dec 6, 2023 9:47:26 GMT
It's good for the other contenders that PRWCX has been turned out to pasture. For those of us that own some, we can proudly enter it in the parades.
I would like to say WOW again.  |
|
|
|
Post by yogibearbull on Dec 6, 2023 11:42:54 GMT
|
|
|
|
Post by archer on Dec 6, 2023 15:10:58 GMT
It's good for the other contenders that PRWCX has been turned out to pasture. For those of us that own some, we can proudly enter it in the parades.
I would like to say WOW again. I attribute it's performance to good management. Also, much of it's stellar performance is due to how well it did during 2000-2003, not losing as if it were a 40/60 rather than a 60/40. more recently in 2018 it handled the first market decline well. THe lack of loses gives it a leg up when catching the rebounds. I don't pay much attention to it as I unfortunately didn't even know the fund existed until after it closed. Starting in 2008 60/40 SPY and PIMIX ran neck to neck with PRWCX but in 2018 PIMIX started lagging and PRWCX pulled ahead again, I am guessing with better bonds. |
|
|
|
Post by gman57 on Dec 6, 2023 23:57:20 GMT
A little off topic but a question re: PV
When you compare say PIMIX with VWALX does PV take into account VWALX's tax exempt distributions in its performance data? Is there a way to even do that?
ADD: I guess if you're in the 24% tax bracket you could take PIMIX income -24% and compare it to VWALX income OR use a tax free yield calculator using VWALX's current yield?
|
|
|
|
Post by yogibearbull on Dec 7, 2023 0:44:24 GMT
gman57, I don't see a way to adjust for tax impacts of taxable vs muni funds. If a PV run has only muni funds, then one can adjust the PV results according to tax brackets.
|
|
|
|
Post by Mustang on Dec 7, 2023 3:50:01 GMT
One final race. I am trying to get to a three fund portfolio: ABALX 50%, VWINX 25%, VWELX 25%. This portfolio will be competing against Vanguard 500 Index Investor in a grudge race. $10,000 each, 4% initial withdrawal adjusted for inflation. Average returns: 500 Index Three Funds YTD 20.6% 7.6% 3 year 9.6% 3.6% 5 year 12.4% 6.6% 10 year 11.7% 6.8% In every single period the 500 Index roughly doubles the three fund portfolio's returns. In previous races VWELX was proven to be one of the winners, ABALX ran mostly in the middle, and VWINX only led during the downturns. With returns like this the handicappers would give the trio long odds especially when recent performance is considered. Long odds indeed. Here is the race, you really should look at the chart: www.portfoliovisualizer.com/backtest-portfolio?s=y&sl=2kcwowK43dZutq5bJZJpewSummary: There is a sequence-of-return problem right out of the gate. Returns during the first part of retirement are far more important than returns at the end. And early returns were bad. 500 Index falls to $5,000 rather quickly, briefly rebounds, then falls to $3,000 (2009). In spite of the returns it never gets above $5,000 again ending the race at $3,700. Three Funds slowly advanced to $15,000 (2007), falls to $9,600 (2009) then races to the finish. $15,000 (2012), $20,000 (2017), $25,000 2021, and finishes with $25,200. At the finish line it was Three Funds $25,200 and 500 Index $3,700 and they both started with $10,000. The accumulation phase and the withdrawal phase are completely different. They need different approaches and different asset allocations to succeed. This is a prime example of a sequence-of-return failure. After a bad start (losing 9.1%, 12.0% and 22.2% the first three years), the SP500 Index Fund could never catch up after taking inflation adjusted withdrawal. This is very similar to a 1968 test of VWELX. It lost 7.8% (1969), 11.8% (1973) and 17.7% (1974). Planning for a 30 year retirement it ran out of money after 25 years. It faced a very strong headwind. Sequenc-of returns and double-digit inflation. Sequence-of-returns is a serious problem. Plan for the worst and hope for the best. |
|
|
|
Post by yogibearbull on Dec 7, 2023 12:33:36 GMT
The SOR problem is seen clearly from TR vs SWR, SWRM (calculated), PWR.
01/2000-11/2023
Hybrid Blend 7.34%, 7.44%, 4.94%, 4.63%
VFINX/SP500 6.74%, 4.34%, 2.67%, 4.07%
While the TR difference doesn't seem high, bad dot.com followed by bad GFC were too much for all-stock VFINX, as seen by low SWR, SWRM, PWR.
SOR problem is NOT detected by TR, SD, Sharpe Ratio, but is seen in withdrawal based measures SWR, SWRM, PWR. These put extra penalty for high volatility.
|
|
|
|
Post by Norbert on Dec 7, 2023 19:02:22 GMT
There's some very interesting information in this thread! I hadn't realized how important SOR is for a retiree making regular withdrawals from a portfolio. This first chart shows Growth of $10K for VFINX (blue), Wellington (red), an Wellesley (yellow), assuming no withdrawals, starting 25 years ago. A 100% VFINX stock portfolio looks best. (Click to enlarge.)  This second chart shows the same funds, but this time with an inflation-adjusted $400 (4%) annual withdrawal:  Wellington is the big winner when annual withdrawals are considered. The all-stock portfolio never really recovers from a combination of early losses combined with annual fixed amount withdrawals. Thanks guys! I had never been aware of this real-world phenomenon pointed out by yogibearbull above. |
|
|
|
Post by archer on Dec 7, 2023 21:27:24 GMT
Also re Norberts Backtest, look how long it took VFINX to catch up in both of the charts, and has yet to catch up against VWELX.
|
|
|
|
Post by retiredat48 on Dec 8, 2023 0:01:42 GMT
From the retiree guru studies, another way to look at this is: 100% stock fund allocation is riskier in running out of money; a 100% bond fund is also riskier. The safe allocation is anywhere between 85/15 and 15/85.
R48
|
|
|
|
Post by Mustang on Dec 8, 2023 0:37:19 GMT
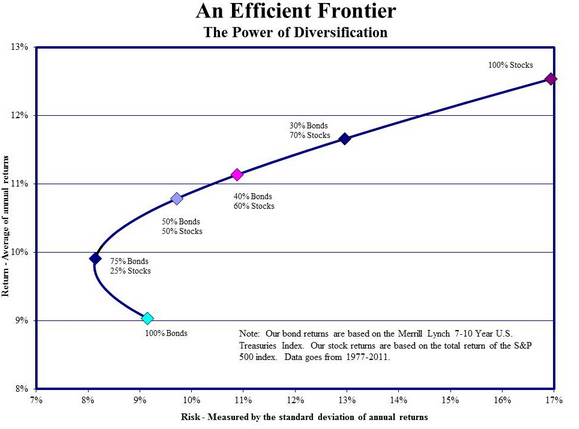
From the retiree guru studies, another way to look at this is: 100% stock fund allocation is riskier in running out of money; a 100% bond fund is also riskier. The safe allocation is anywhere between 85/15 and 15/85.R48 In order to generate enough returns to support a 4% withdrawal some risk is required. The best odds of success lies between 50-75% equity.
Historic success rates for 4% initial withdrawal from Wade Pfau's 2018 update of the Trinity Study.
Payout Period
Allocation 25 yr. 30 yr. 35 yr. 40 yr.
100% stock 99% 94% 91% 89%
75% stock 100% 98% 93% 92%
50% stock 100% 100% 97% 87%
25% stock 100% 87% 71% 45%
0% stock 79% 44% 28% 11%
Modern Portfolio Theory Efficient Frontier's efficient frontier showing maximum return for each level of risk.
|
|
|
|
Post by habsui on Dec 8, 2023 2:43:15 GMT
Not sure whether M* report agrees with the best stock/bond allocation ratio.
|
|
|
|
Post by richardsok on Dec 8, 2023 3:05:15 GMT
Ver-r-r-ry interesting, guys. I truly enjoyed reading the theoretical conversation. Now how about brass tacks? What might be your realistic retirement portfolio that beats the back-tested tar out of Vanguard 500?
I propose these parameters: Use PortfolioVisualizer. Start with $10,000 January 2008 to the present. Reinvest all dividends, BUT withdraw $500/year for your retirement living expenses. No market timing or DCA. No individual stocks; just OEFs, CEFs and ETFs. No 2x funds. Just one buy in 2008 and hold to the present.
My portfolio: $10,000 Jan 2008 grows to $19,540 today. Consists of PIMIX 33%, PTY 34%, and PFF 33%. (PTY all by itself beats the Vang500 too, but I think it unlikely a successful retiree would put his entire worth into just one CEF. I'm hoping for realistic here.)
Compare it to Vanguard 500: $10,000 Jan 2008 grows to $17,695.
What else would have worked?
|
|
|
|
Post by archer on Dec 8, 2023 4:51:55 GMT
richardsok, What do you mean by realistic? QQQ grew to $42,966. Realistically, "I" wouldn't hold 100% QQQ, but that's just me, and I am sure plenty of others.
|
|
|
|
Post by richardsok on Dec 8, 2023 5:03:33 GMT
richardsok , What do you mean by realistic? QQQ grew to $42,966. Realistically, "I" wouldn't hold 100% QQQ, but that's just me, and I am sure plenty of others. Thanks, archie. Yes, you're right. QQQ really starred. I agree, it's rather unlikely that a typical, affluent retiree might put EVERYTHING into QQQ, --- but it's still marginally more plausible than he'd put it all into PTY, IMO. (ETF vs CEF). So QQQ is indeed a good answer. Evidently none of us in this forum thought to do it. Would you do it today? Hoping for real-world realistic set-ups, if possible. |
|
|
|
Post by archer on Dec 8, 2023 5:26:35 GMT
OK, a little more probable:
50% VWINX
30% QQQ
20% PIMIX
Result $21,299 and beat the PRWCX benchmark I often use when I amuse myself with these exercises, and with a better Sharpe.
I don't think this formula would work going forward. PIMIX is nothing like it used to be, and I wouldn't be surprised if we have a long term rotation from growth to value sometime in the next several years.
|
|
|
|
Post by Norbert on Dec 8, 2023 6:07:39 GMT
yogibearbull's PRWCX replacement looks interesting to me: "62% TCAF + 20% PYLD + 18% USFR". I wouldn't want want to use index funds, as stock selection would be driven solely by market cap percentages, with no attention paid to valuations. Giroux's success with PRWCX is partially due to stock selection, but also to his ability to competently adjust asset allocation depending on market conditions. That's not easy to replicate. Another approach would be to put 80% of the money into a fixed allocation per the above; and use 20% for shorter-term trading ideas ... if so inclined.
|
|
|
|
Post by richardsok on Dec 8, 2023 6:29:44 GMT
PRWCX. Yes, extraordinary chart, especially so because its volatility is amazingly low over the years.
|
|
|
|
Post by fishingrod on Dec 8, 2023 9:07:12 GMT
Not sure whether M* report agrees with the best stock/bond allocation ratio.
I'm no longer a paid subscriber to Morningstar. Which asset allocation are you talking about. Wade Pfau's or Merrill Lynch's. The former is based on historical data 1926-2017. The latter 1977-2017. It would take a lot for Wade Pfau's data to change since it's methodology is the same as Bengen's and the Trinity Study. The worst 30-year retirement period in history hasn't since Bengen's 1994 study. It still the stagflation years.
On the other hand the efficient frontier could easily be different. It changes all the time based upon the period selected. I couldn't find a the Ameritrade chart (1970-2019). In it the efficient frontier has shifted a bit. Merrill Lynch's minimum risk portfolio is 75% bonds and 25% stock. Ameritrade's is 67% stock and 33% bonds.
P.S. This is the first time I've missed giving up my subscription. It would be interesting to know what it said.
Perhaps it is this article. Based on M* research starting in 2021. It estimates, 90% success rate of a 4% withdrawal from a 20% to 40% stock allocation for 30 years.
I don't think you have to be a paid M* to read article. It gives reference to the research papers you can get by giving email. |
|
|
|
Post by Mustang on Dec 8, 2023 11:11:43 GMT
I have seen Amy Arnott's article before. Bengen, Trinity Study, and Wade Pfau's update are all using historical data. Morningstar is using predictions. Over last three years Morningstar has changed their safe withdrawal rate from 3.3% to 3.8% and now 4.0%. They are using Monte Carlo simulations which is sensitive to user inputs. Small changes in inputs can make large changes in outcome. In 2021 Morningstar predicted equity returns of 8.0% and fixed income 2.7%. Last year it was 9.88% and 4.44%. Now its 9.41% and 4.81%. Lower equity and higher-fixed income returns shifted the stock/bond asset allocation toward bonds. The 40/60 allocation they are predicting is really good news for WVINX.
"But the investment return assumptions that Morningstar used for its analysis were so low – with real returns averaging just 5.7% for equities and 0.5% (!) for fixed income over 30 years – that, if those projections were to come to pass, the next 30 years would be among the very worst market environments in U.S. history... there is no precedent – even in other eras with high equity valuations – for 30-year returns that low... " "In this way, Morningstar’s choice to focus on (historically low) 30-year returns for its analysis disregards the evidence of what really drives safe withdrawal rates, which is the sequence of returns. Because the periods that have tested the 4% rule in the past were not necessarily those with the worst 30-year returns, but those whose returns in the first 10-15 years were so bad that retirees needed to withdraw too much of their portfolio to be able to recover once conditions improved." Later he says, "Most significantly, these low returns are projected for the entire 30 years of the study, leaving little wonder as to why the paper concludes that the safe withdrawal rate will also be lower than previous estimates that were based on historical returns." "Sequence Of Returns Matters More Than Average Returns For Safe Withdrawal Rates... The problem with [Morningstar's] method, however, is that Monte Carlo analysis generates a random sequence of returns for each simulation, when, in reality, market returns are generally not random from one year to the next... For retirees, therefore, it is not a matter of whether they will experience a period of below-average returns during retirement – for such periods will occur in almost any retirement horizon – but where in the succession of bull and bear market cycles their retirement date takes place that will have the most impact on their safe withdrawal rate." That was his response to the 2021 paper. His critique has many points that extend to all of their papers. Their predicted average returns extend out 30 years. Changes in returns are random ignoring the sequence-of-return risk that really determines safe withdrawal rates. They ignore the tendency of the market to revert to the mean.
My guess is the reason the 60/40 portfolio was replaced with a 40/60 is that Morningstar's predictions basically predicted decreased stock returns and increased bond returns extending 30 years into the future. I applaud Morningstar's effort in trying to predict the future. That is very hard to do and any accuracy would be short term at best. |
|
|
|
Post by mnfish on Dec 8, 2023 13:36:16 GMT
I played around with PV and here's my 2 cents with what caught my eye when I ran a scenario of a retiree with $1m beginning in 2007 withdrawing $40k annually inflation adjusted. It took 14 years (2007-20) of inflation to grow the withdrawal by $10k or a 25% increase. PRWCX grew 115%, even with withdrawals, in that time period. It only took 3 years (2021-23) to grow it by a second $10k or a 20% increase. PRWCX grew 13%. Using a 3% avg going forward it will take 5 more years to grow it by another $10k (16%). In the next 5 years PRWCX will grow?  We all better thank our lucky stars we had 14 years of low inflation and an SP500 that returned 212%. |
|
|
|
Post by mnfish on Dec 8, 2023 14:26:32 GMT
So, now that you've won the race and are age 70, have $2m (thanks Mr Market) and can live off of an inflation adjusted $80k.
A simple spreadsheet will show that with 3% annual growth and 3% annual inflation you'll still have about $2m at age 90.
|
|
|
|
Post by retiredat48 on Dec 8, 2023 14:31:08 GMT
Mustang,...A sidebar. Mustang...I consider you the forum guru re retirement portfolio longevity; I read all your posts and appreciate them. Keep up the good work and postings. I did similar to you about 25 years ago, and am familiar with all the studies and retirement pro gurus you cite. (I just don't have a need to keep up as much). My focus is more on: Given these sets of statistics and numbers, what is one to do??" Please take any replies in good faith. R48
|
|
|
|
Post by retiredat48 on Dec 8, 2023 14:53:47 GMT
yogibearbull 's PRWCX replacement looks interesting to me: "62% TCAF + 20% PYLD + 18% USFR". I wouldn't want want to use index funds, as stock selection would be driven solely by market cap percentages, with no attention paid to valuations. Giroux's success with PRWCX is partially due to stock selection, but also to his ability to competently adjust asset allocation depending on market conditions. That's not easy to replicate. Another approach would be to put 80% of the money into a fixed allocation per the above; and use 20% for shorter-term trading ideas ... if so inclined. A caution...I have owned PRWCX in the past; I now have only a toehold because it is a closed fund and i want to be able to buy it. I am a big fan of Giroux. But the caution is that basing future performance on the past can be tricky. Guru fund manager Bill Miller beat the S&P500 for fifteen straight years--until he didn't one year. And that poor performance continued for several years. My caution is Giroux has made a very large bet on titling to "green" companies; environmentally friendly ones. I don't consider retirees locking in a portfolio forever, have to take the risk that goes with this concentration, just to possibly get an outsized return. I note "green", from ETVs to windmills, has hit a wall in last few months...fundamentally in terms of order cancellations, etc. High interest rates crimping cap X investment for green companies; utilities in a bind etc. A tectonic slowdown may be emerging. I may invest in TCAF after a shakeout occurs; but even then only a modest amount. R48 |
|
|
|
Post by retiredat48 on Dec 8, 2023 15:01:56 GMT
Mustang ,...A comment on Mustang's table. I note his survival rate has this number for 75% stock allocation: 75% stock: 100% of portfolios (survive 25 years)...... 98%(survive 30 years) My comment is this is a reasonable risk for retirees seeking 30 years out. Like if you run out of money at year 29 (mostly due sequence of return experience), you were certainly long aware of it, and could take mitigating action before hand. Mitigating action, such as working three weeks for addl income in XMAS season; putting it into IRAs, and boosting the shortfall. I was planning to be a highway toll collector in Florida, if necessary, but I notice even they have been automated out! R48
|
|
|
|
Post by yogibearbull on Dec 8, 2023 15:18:25 GMT
For PRWCX & the new PRCFX, my basic idea for their simulation is to combine a blend/value equity fund with a multisector bond fund and an ultra-ST/ST bond fund (to control volatility inherent in equity and multisector bond). Many OEF alternatives can be found for longer runs of PV, but I haven't found a good static/fixed mix yet - I think that Giroux' secret is not only the stock and bond components, but changing their mix a bit opportunistically.
Using the ETFs should take care of tax-inefficiency of hybrid OEFs, especially, possible large yearend CG distributions. The DIYs can tinker with the weights of what seem the best-of-breed ETFs - Giroux at TCAF (and PRWCX, PRCFX), Ivascyn/Murata at PYLD (and PONAX/PIMIX; PDI, PDO, PAXS, etc). So, the following weights for these 3-ETFs alternatives are tentative, subject to ongoing modifications. Unlike the horse races run already (mentioned so far), this horse race is for the future.
PRCWX: 62% TCAF + 20% PYLD + 18% USFR
PRCFX: 38% TCAF + 30% PYLD + 32% USFR
|
|
|
|
Post by archer on Dec 8, 2023 15:23:53 GMT
retiredat48 , Fidelity Magellan was another fund that had its early heyday and then mediocrity. My main concern for PRWCX and TCAF is that Giroux isn't a young man. I expect he will likely retire before long. @yogi, I am not finding PRCFX anywhere, and am being referred to PRGFX. ?
|
|
|
|
Post by retiredat48 on Dec 8, 2023 15:37:12 GMT
|
|